
Display digitized data as a time domain chart with up to 2 channels per time domain chart. You can add up to 4 frequency domain chart gadgets on the Graphics Setup tab.
Adding Channels to Frequency Domain Chart
Note: This gadget is available for the Digitizer Channels only.
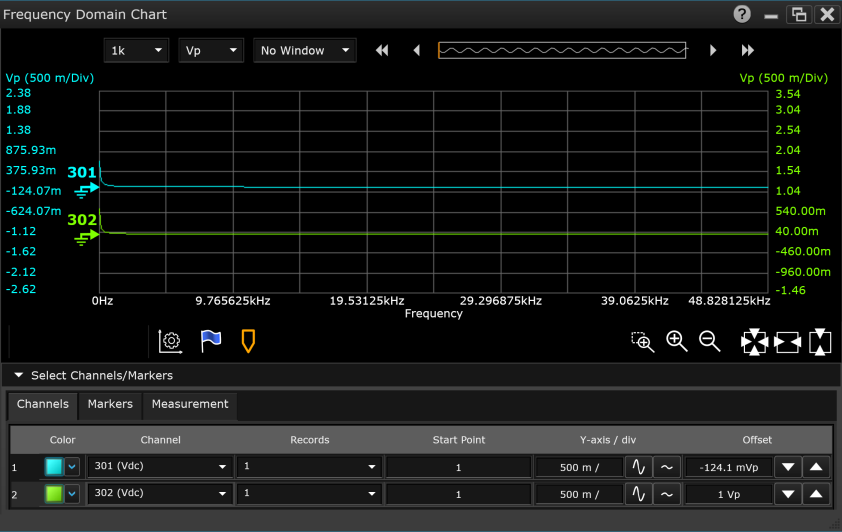
To add channels, go to the Select Channels/Markers drop-down menu at the bottom of the window, click on the Channels tab, and then assign the desired channels. You can also select the desired trace color, the channel's data records, start point, vertical scale, and vertical offset.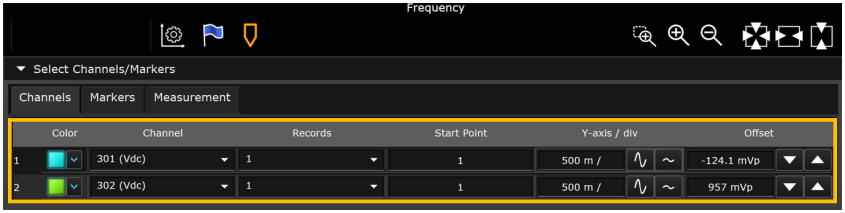
Select the desired gadget window (the selected window is highlighted in blue) to display the Properties pane on the right side of the Graphics Setup tab. The available properties vary according to the type of gadget selected.
Caption - Enter the desired title to appear at the top of the current gadget window. You can specify a caption with up to 30 characters including letters, numbers, and special characters.
Trace Thickness - Set the thickness of the displayed trace to a value between 1 (default, thin trace) and 5 (thick trace).
Waveform Setting - Set the FFT size, Y-axis unit, and the Windowing Function.
X-axis range settings - Set the range for the X-axis.
Column Separator - This is a global setting for all gadgets that display data from a scan. Select the desired separator from the drop-down list – tab, comma, or semicolon. Click the Copy Data to Clipboard button to export the data from the current gadget to the Windows clipboard.
Copy Data to Clipboard - Export the data from the current gadget to the Windows clipboard.
Copy Image to Clipboard - Export a screen shot of the selected display gadget to the Windows clipboard.
The Measurement Operations menu allow you to add in various measurement functions for quick data analysis.
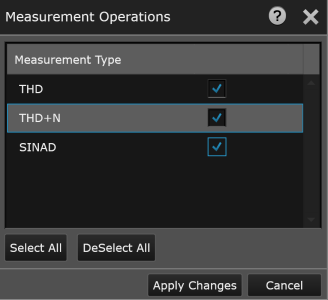
The available measurement operations are:
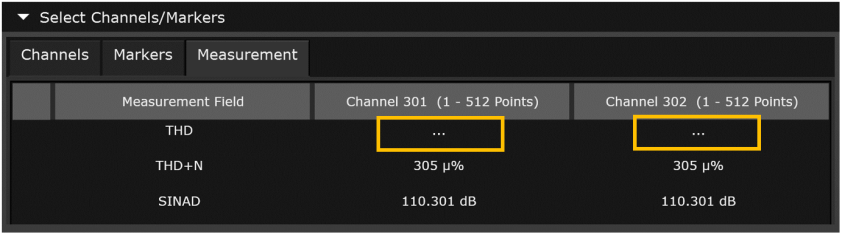
To view the measurement data, go to the Select Channels/Markers drop-down menu at the bottom of the window, click on the Measurement tab. The measurement data for each of the selected operation will be displayed for their respective channels.
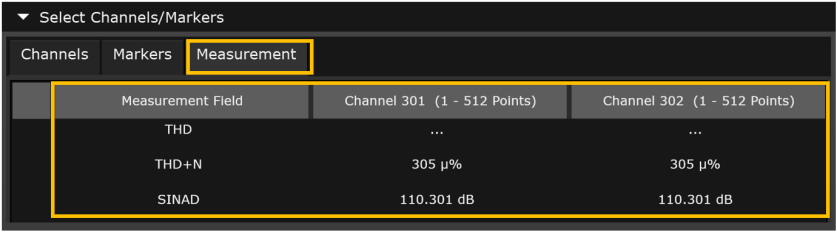
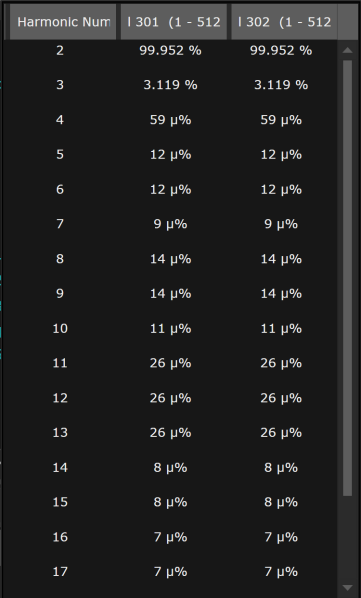
Note: To view the THD measurement data, click on ... on the Channel column and the results will be displayed in a new pop-up dialog as below:
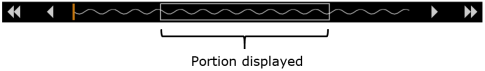
The Data Preview Bar gives a visual indication of the portion of the data that is currently displayed in the chart. The area highlighted in grey is the portion of the data that is currently displayed.

|
Insert text annotation on the graph. To insert a text annotation, click |

|
Show vertical markers. Click |

|
Area zoom. Use the mouse to draw a frame around the desired area of the graph to zoom in on. |

|
Zoom in horizontally. To zoom in vertically only, click on the waveform (waveform turns into a thick line) and zoom in. Click the waveform again to return to the normal zoom mode. |

|
Zoom out horizontally. To zoom out vertically only, click on the waveform (waveform turns into a thick line) and zoom out. Click the waveform again to return to the normal zoom mode. |

|
Auto scale the trace on both the x- and y-axis. |

|
Auto scale the trace on the x-axis. |

|
Auto scale the trace on the y-axis. |
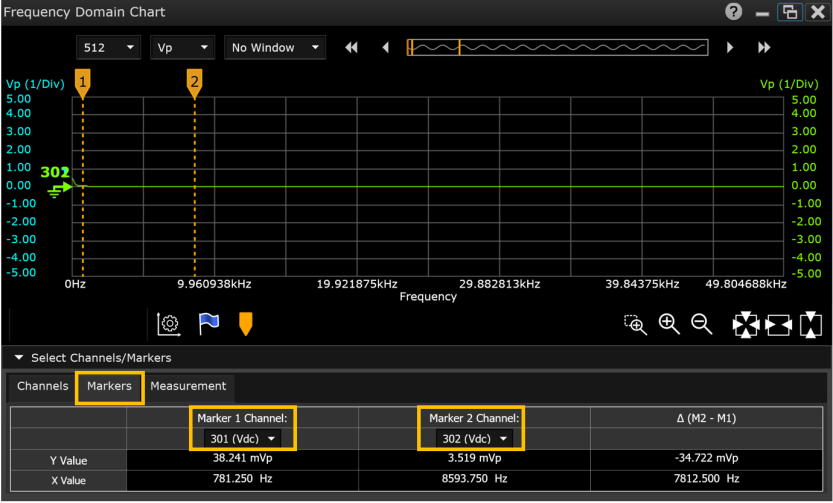
When a graph is displayed, you can position two vertical markers to display measurement data for each marker position and display the relative measurement data between the markers (∆M2 ‑ M1). To link specific digitizer channels to the two markers, go to the Select Channels/Markers drop-down menu at the bottom of the gadget window, click on the Markers tab, and then select the desired channel for each.
If the markers are not being displayed on the graph, click to display markers.
To position the markers, click  or
or  and drag the marker left or right. The example above shows marker 1 and marker 2 positioned on the graph with the corresponding marker measurement data displayed below the graph. In this example, Channel 301 is linked to marker 1 and Channel 302 is linked to marker 2.
When a marker is moved off the graph (by zooming in on the trace, for example), it appears at the upper left or right corner of the graph.
To hide markers, click  .
.
Right-click anywhere on the Time Domain Chart to display these options:
Save Chart Image to File - Export a screen shot of the chart in full color to a JPEG, BMP, or PNG file. By default, the screen shot is stored in the "My Documents" folder on your computer. For example – C:\Users\<user_name>\Documents\Keysight\BenchVue\DAQ\Exports\.
Save Chart Image to Gray Scale File - Export a screen shot of the chart in black and white to a JPEG, BMP, or PNG file. By default, the screen shot is stored in the "My Documents" folder on your computer. For example - For example – C:\Users\<user_name>\Documents\Keysight\BenchVue\DAQ\Exports\.
Copy Chart Image to Clipboard - Export a screen shot of the chart to the Windows clipboard.
Copy Data to Clipboard - Export the data from the current gadget to the Windows clipboard.